The year 2020 saw the COVID-19 pandemic as a protagonist, the necessary security measures adopted have led to changes in their way of working, studying and relating to many people. It was the year of the boom in smart working, distance learning and, in general, it was the year of greater use of online platforms and services.
TOP-IX analyzed, from its own point of view and leveraging open data, the change in the behavior of access to Internet services and performance on the network.
After an initial in-depth analysis carried out at the beginning of the year, monthly checks were carried out where we observed a re-adjustment in the average and median values compared to previous years during and after the summer period.
In this article we summarize the main observations concerning three points of view:
- Observations on the network traffic
- Performance analysis on SpeedTest by Ookla
- Subsequent checks with data from Measurement Lab
Observations on the network traffic
The first analysis monitored the volume of the Internet traffic going through the TOP-IX infrastructure from the end of January to March.
The average values and maximum values were taken into account for each day, showing strong growth from the beginning of March with increased traffic in the following weeks (Figure 1).
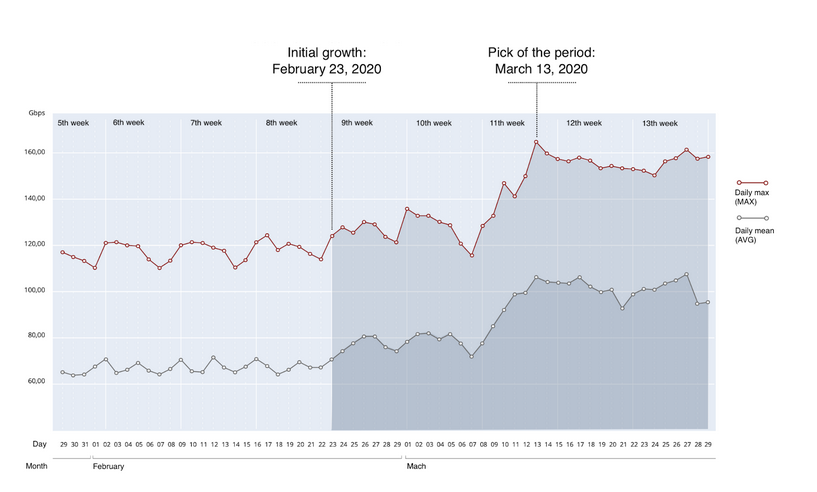
Figure 1: Trend of the entire traffic on the passing through TOP-IX network
This first result shows the important effect of the first Italian lockdown that officially began on March 9th. In a second phase of this first part of the research we observed the average daily traffic exchanges on individual CDNs that expose some changes in behavior on the use of web services.
This evidence validates the hypothesis of how even a partial and local view of the network can perceive the consequences of the global phenomenon of restrictions due to the pandemic.
Performance analysis on SpeedTest by Ookla
The TOP-IX instance of the Ookla SpeedTest initially allowed us to analyze the variation in latency and jitter (the packet delay variation) in the period from October 2019 to March 2020 (except for the period from mid-January to mid-February).
It should be noted that the approximately 180,000 tests analyzed are mainly carried out around the Turin area and neighboring regions and only a small part from more distant locations in Italy and abroad.
It was decided to group the data by day and compare the mean and the median to observe the trend over time.
Latency analysis
The following heat map clearly shows the increase in latency in the average and median daily values (in particular from 12 to 16 March).
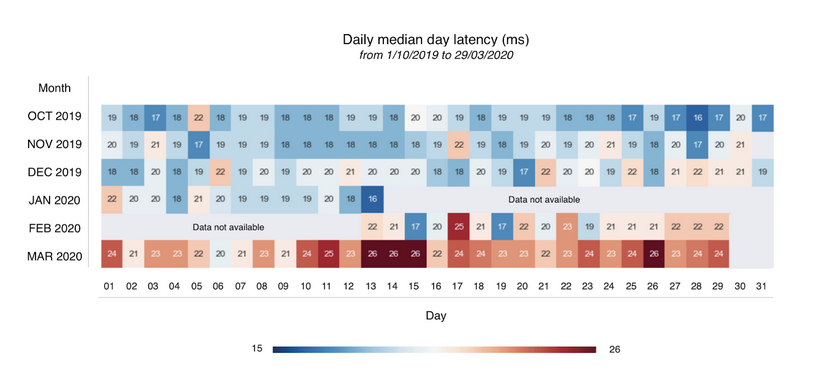
Figure 2: Heat map of median daily latency values (ms)
The boxplot graphs in Figure 3 reflect even more clearly the trend of all the speed tests acquired monthly. We note how the distribution of latency in the different months is shifted towards higher values for both median and average values.
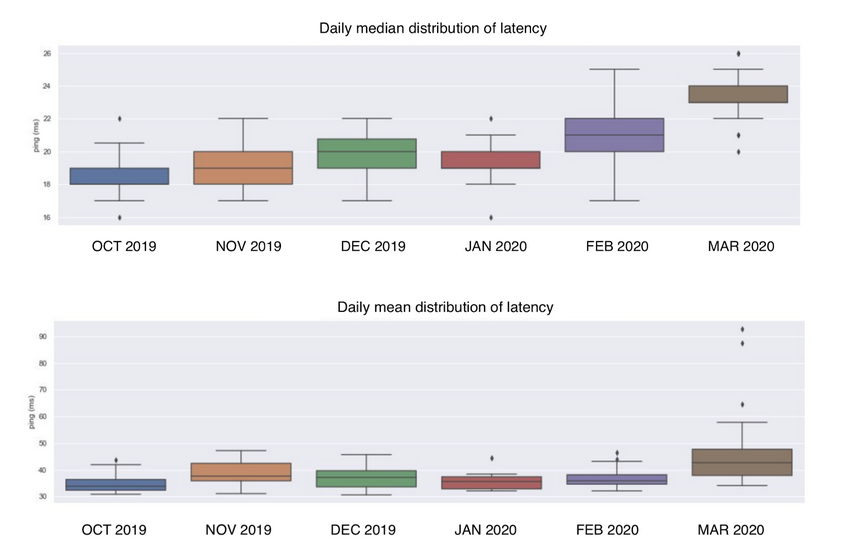
Figure 3: Boxplot of the months from October to March of median and mean latency data (ms)
Jitter analysis
From the graphical representations with heat map (Figure 4) and with box plot (Figure 5), we note even more clearly the statistical arrangement of the daily values for each month: in March there is an increase in jitter values (ms) which confirm the greater congestion of the network.
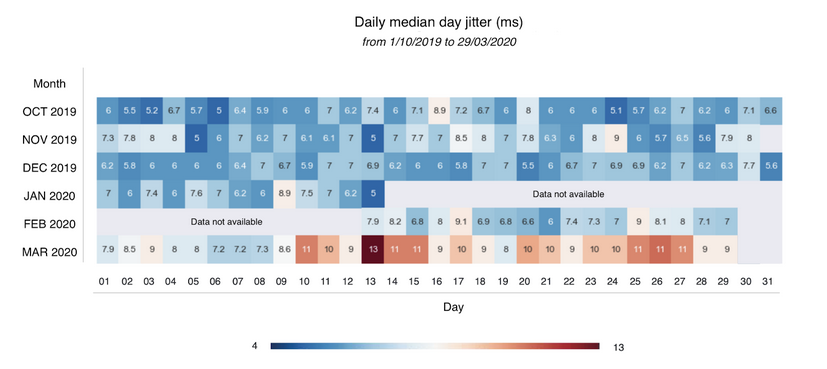
Figure 4: Heat map of median daily jitter values (ms)
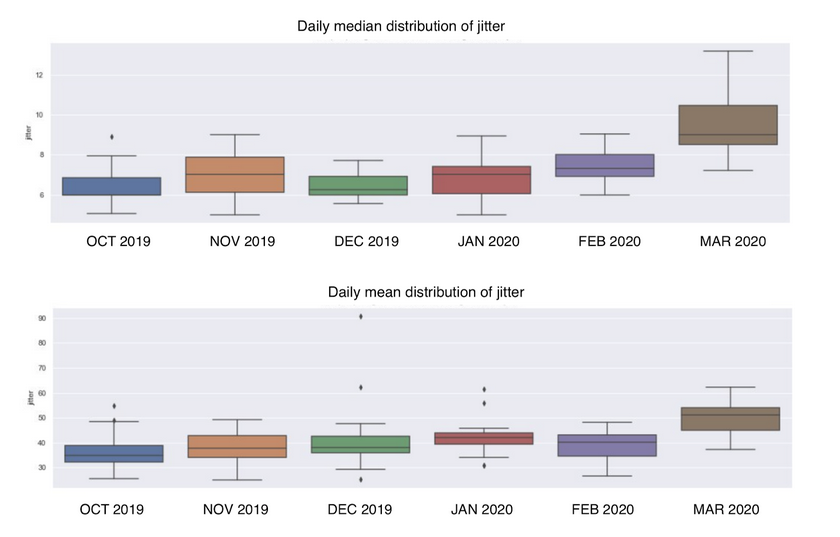
Figure 5: Boxplot of the months from October to March of median and mean jitter data (ms)
Subsequent checks and controls
To monitor the situation after the Summer, we carried out monthly checks on the overall performance via Ookla SpeedTest tests of the TOP-IX instance, therefore the tests are mostly from the Piedmont region.
In Figure 6 and 7 we can see the trend of 280 thousand tests acquired from the end of February to the beginning of December 2020. Both jitter and latency trends show a decrease in the daily median values from May to October. In particular, it emerges that for latency there is a considerable variation also in the months of July August and then decreases in September.

Figure 6: Daily median values of jitter of all test on TOP-IX’s Ookla instance from mid February to the beginning of January 2020
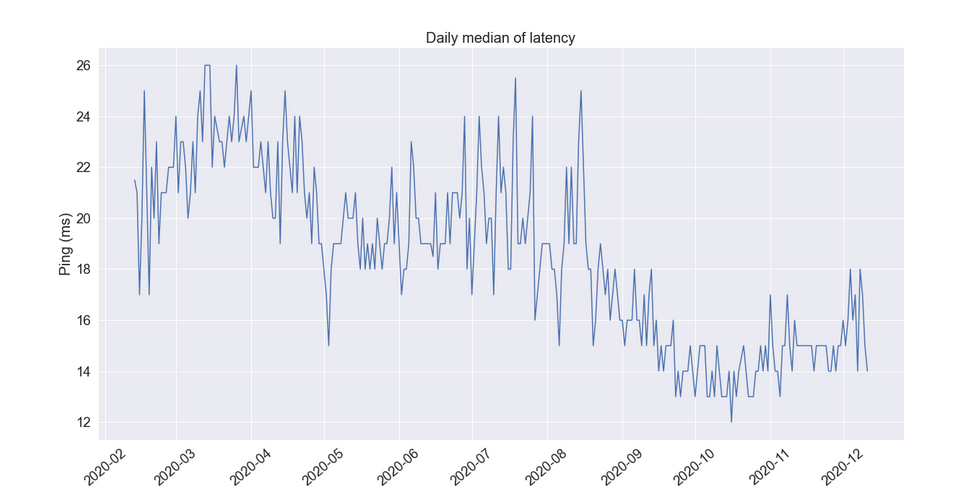
Figure 7: Median daily latency values of all test on TOP-IX’s Ookla instance from mid February to the beginning of January 2020
Finally, we note that the median daily values, of jitter and in particular of latency (see Figure 8), are increasing again in November and early December. This observation is in line with the seasonal trends of past years.
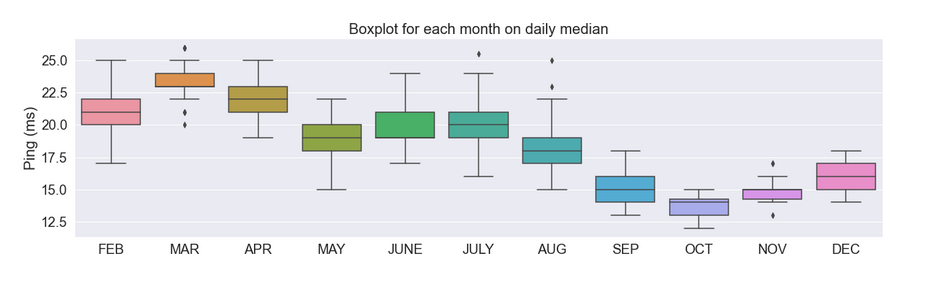
Figure 8: Monthly distribution of median daily latency values of all test on TOP-IX’s Ookla instance from mid February to the beginning of January 2020
We can assume that the carriers and Internet Service Providers fortified their resources and infrastructure due to the experience during the difficult months during the spring.
This improved their ability to face new restrictions, the relative return to distance learning, and an increase in remote work after the summer.
Subsequent checks with Measurement Lab data
To track performances on the network, we used data made available by Measurement Lab, the internet metrics collector supported by Code for Science & Society, Google and partners from all over the world, including TOP-IX itself which hosts machines dedicated in our data center.
These metrics are collected through an open source performance test implemented in Google services and in various web applications that gives detailed data released in tables on Google BigQuery.
Internet upload and download performance tests are saved in two separate tables optimized for research uses. This analysis used 378,000 tests from the download table and 323,000 from the beginning of January to the beginning of December carried out in Italy (geolocation via MaxMind).
Among the parameters made available, we focused on geographic information in the various Italian regions and latency trends. For this specific case study we used the download and upload speed values as control parameters for the observation of anomalous phenomena and identification of outliers that could have distorted the statistics.
This overview confirmed the previously mentioned trend on latency in Piedmont, observing the minimum Round Trip Time (RTT) parameter proportional to the latency trend.

Figure 9: Monthly distribution of the daily median values of minimum RTT in Piedmont (M-Lab tests)
Using Measurement Lab’s open data, we also made comparisons among Italian regions, for example with Lombardy, where we notice, albeit in a less evident way, the spring anomaly and then return to the known seasonal pattern after the summer.
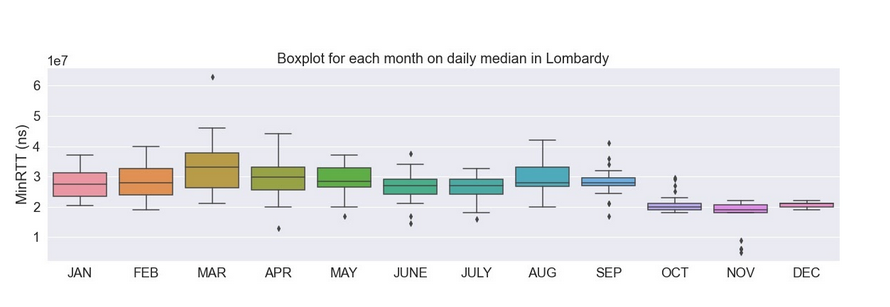
Figure 10: Monthly distribution of the median daily minimum RTT values in Lombardy (M-Lab tests)
Conclusion
We can confirm that the study of traffic passing through dedicated CDNs is an excellent parameter to note, albeit partially, the behavioral change in the use of the various services offered on the Internet, and as network performance metrics, in particular latency and RTT, they can be influenced and used as control parameters for observations.
We’d like to underline that the analysis carried out is a partial point of view on the phenomenon due to the fragmentation of the traffic from large content providers on different networks and CDNs and by the fact that the performance sample collected is a function of the same accessibility to the network.
We hope that in the future these different organisations will be able to share data toward collaborative analysis to get closer and closer to a global vision of similar phenomenologies.