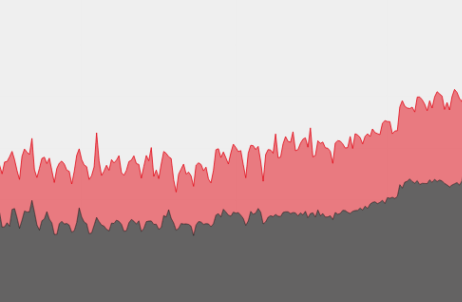

Monitoring of network performance and throughput across the TOP-IX infrastructure.
A comprehensive overview designed to analyze traffic flows, peak usage, and long-term growth trends.
The metrics displayed represent the aggregated traffic managed through the switches and nodes of the TOP-IX network.
Data is collected via MRTG software tool and rendered through Plotly interactive graphs, enabling precise monitoring of infrastructure performance.
Consult the graphs below for a detailed visualization of current traffic loads and historical network trends.